 Contested
Analytics
Measure What
Actually MattersReal-time social performance, geographic reach, platform breakdowns, and campaign ROI — all from your Contested dashboard. Prove the value of every athlete partnership with data your leadership team trusts.
No more asking athletes for screenshots or manually tallying engagement in spreadsheets. Your analytics dashboard pulls live data from every platform, calculates cost efficiency automatically, and generates exportable reports on demand.
Everything Your CMO and CFO Look For
Live metrics that prove every dollar. No screenshots, no spreadsheets—just the numbers your leadership expects.
Campaign ROI
See your return on every dollar. The ROI multiplier, cost-per-engagement, and cost-per-1K impressions update automatically as athlete content performs.
- ROI multiplier: spend vs. engagement value, calculated live
- Cost-per-engagement and CPM across all campaigns
- Side-by-side efficiency comparison across campaigns
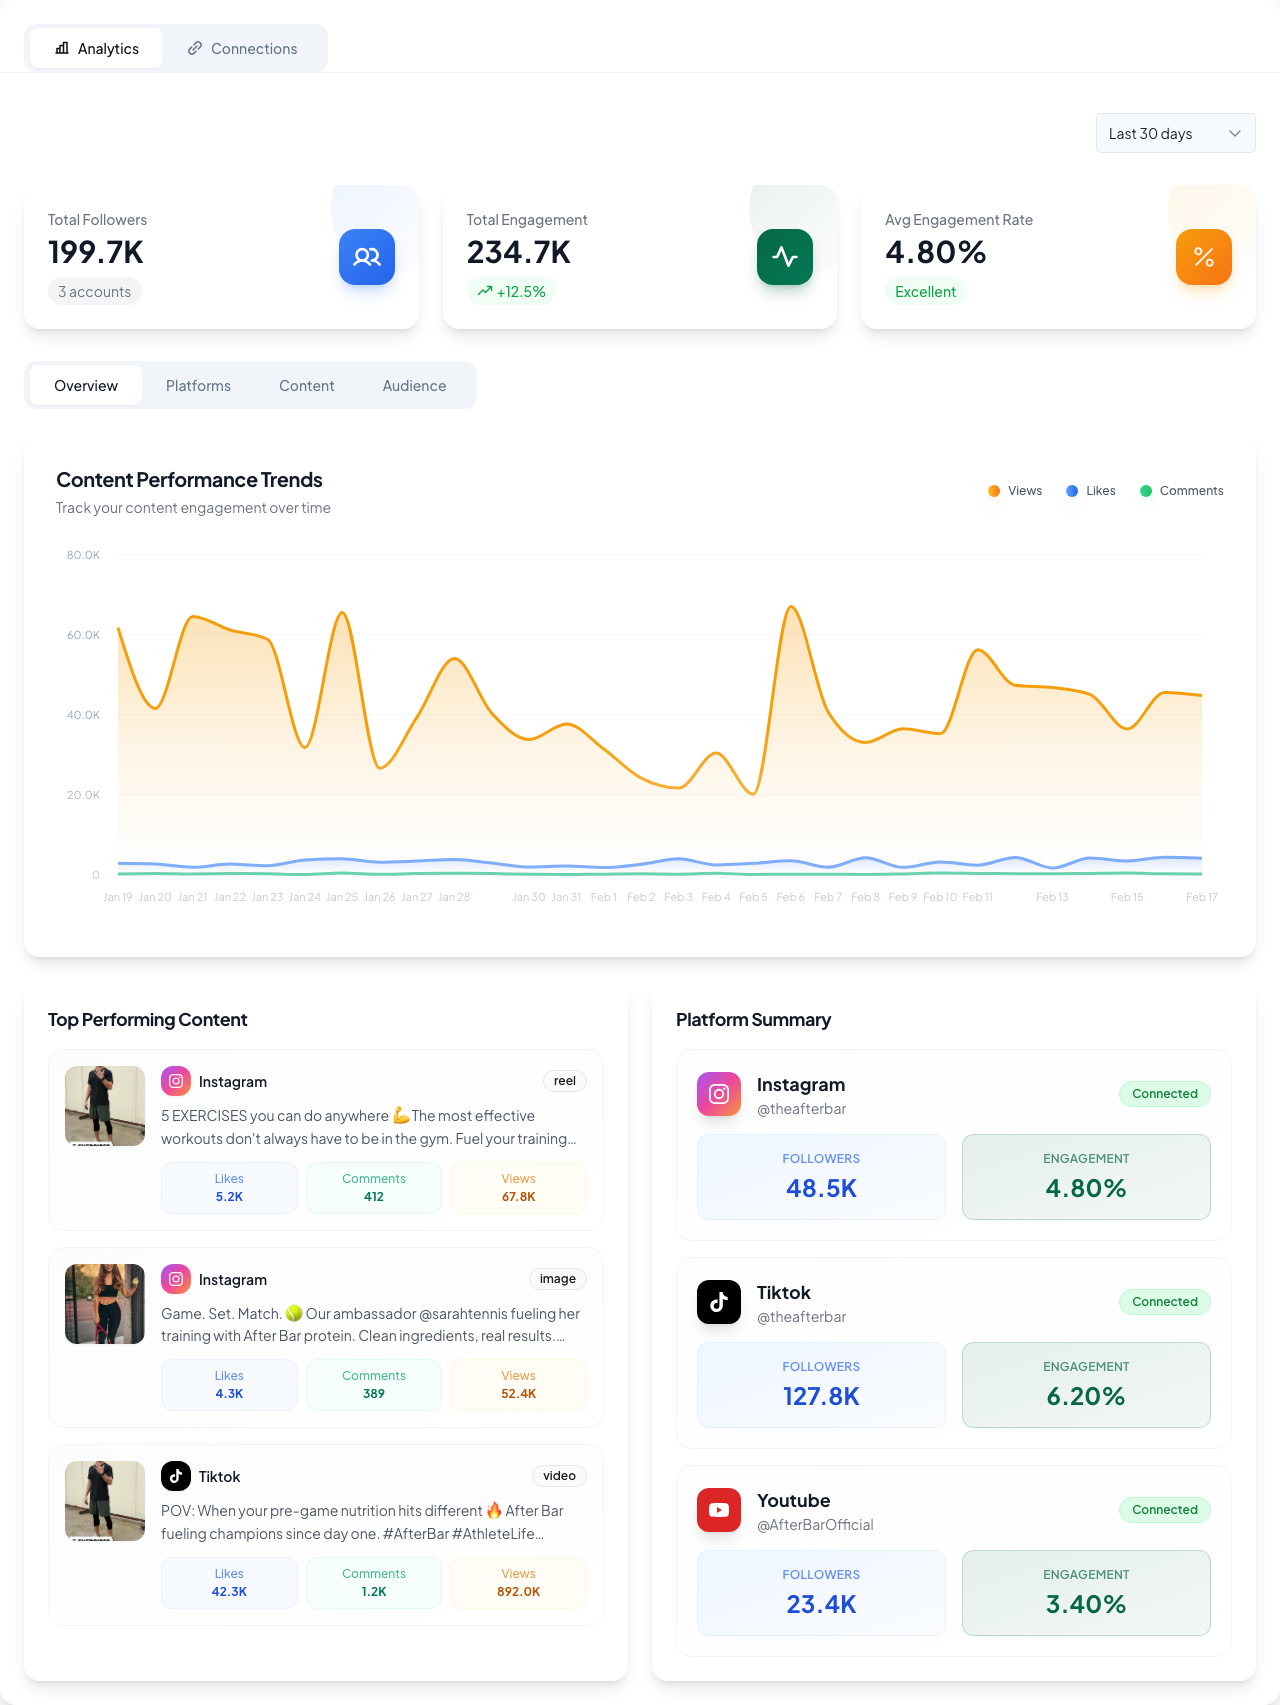
One Screen, Full Picture
Follower totals, engagement trends, top-performing content, and platform comparisons — all in a single view. No toggling between tools or waiting on reports.
Performance trends
Views, likes, and comments charted over time
Top content surfaced
Best-performing posts ranked automatically
Platform summary
Followers and engagement rate per platform
Campaign Performance
Last 7 days
2,847,300
Total Reach
6.8%
Engagement Rate
4,312
Conversions
$0.42
Cost / Engagement
Reach by Day
Know Your ROI in Real Time
See exactly how your athlete partnerships are performing. Track total reach, engagement rate, conversions, and cost per engagement in real time — plus an ROI multiplier that proves the value of every dollar spent.
The weekly trend chart shows reach velocity so you can identify which content is gaining traction and double down on what works. Delta badges show week-over-week movement for every KPI — green means trending up, red means it needs attention.
- Total reach, engagement rate, conversions, and cost-per-engagement
- ROI multiplier updated live as content performs
- 7-day reach velocity chart to spot trending content
- Week-over-week delta badges on every metric
See Which Platforms Drive Results
Understand which platforms are driving results. Compare performance across Instagram, TikTok, and YouTube with per-platform engagement, impressions, follower growth, and traffic source breakdowns.
Toggle between platforms to see how the same campaign performs across different audiences. Traffic source charts reveal whether reach comes from algorithmic discovery, followers, or direct traffic — so you know where to double down.
- Per-platform reach, engagement rate, and follower growth
- Traffic source breakdown (For You, Search, Following, Direct)
- Top-performing post highlighted per platform
- Saves, shares, and new follower metrics per platform
Platform Breakdown
Cross-platform metrics
1.6M
Reach
10%
Eng. Rate
156K
Engagements
2,100,000
Impressions
18,200
Saves
9,800
Shares
68,200
New Followers
Top Video
890K views · 72.1K likes
Traffic Sources
Audience Insights
2,847,300 reached
Age Distribution
25–34 is primaryGender Split
Top Locations
Top Interests
Know Exactly Who You're Reaching
Know exactly who your campaigns are reaching. Explore age brackets, gender splits, top geographic markets, and interest categories to ensure your brand is connecting with the right audience — not just a large one.
Cross-reference audience demographics with your target customer profile to validate alignment. Use interest data to refine future campaign briefs and athlete selection criteria for tighter targeting.
- Age distribution with primary segment highlighted
- Gender split shown as an animated donut chart
- Top cities ranked by percentage of total reach
- Interest categories with affinity percentages
Cost Efficiency Metrics
Prove every dollar is working
Know exactly what each engagement, impression, and conversion costs. These metrics update in real time as content performs — so you're never reporting stale numbers to leadership.
Athlete Leaderboard
See who's driving results
Rank athletes by engagement rate, total reach, or cost efficiency. Identify your top performers so you know who to re-book for future campaigns — and who to pass on.